

Every neighborhood
has a fire story.
We map it before
it's written.
Mapping 2.4M+ parcels across 18 California counties · Used by 6 state-licensed carriers
From one porch to
one hundred thousand acres.
Scroll outward. The data doesn't simplify as the scale grows — it compounds. Each zoom reveals patterns invisible at the level above.
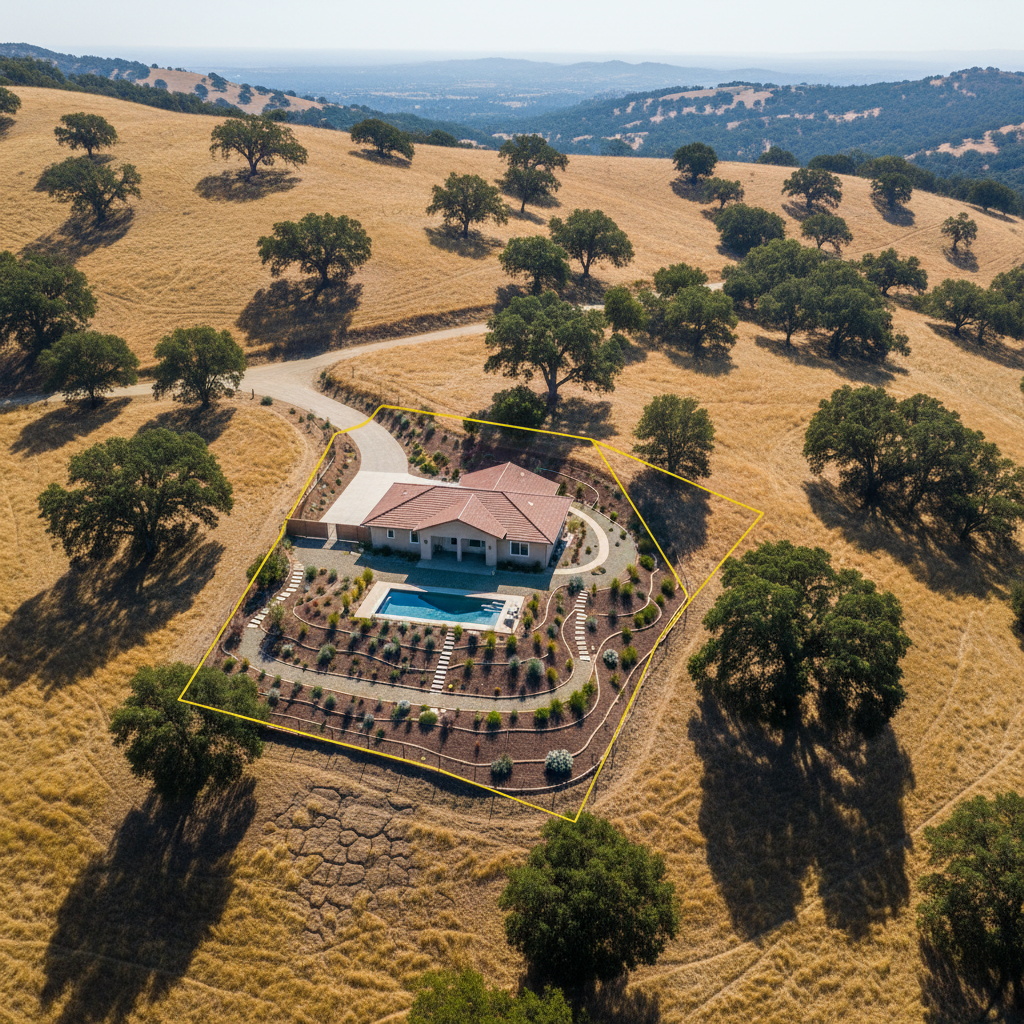
047-221 · Ridgeline Rd, Napa County
The invisible line starts here.
A single parcel's defensible space, ember-path exposure, and slope-aspect score — the three variables that determine whether a home survives a passing fire front. Parcel 047-221 scores 87/100 for risk. Its neighbor scores 34/100. Same ridge. Different outcomes.
Risk Score
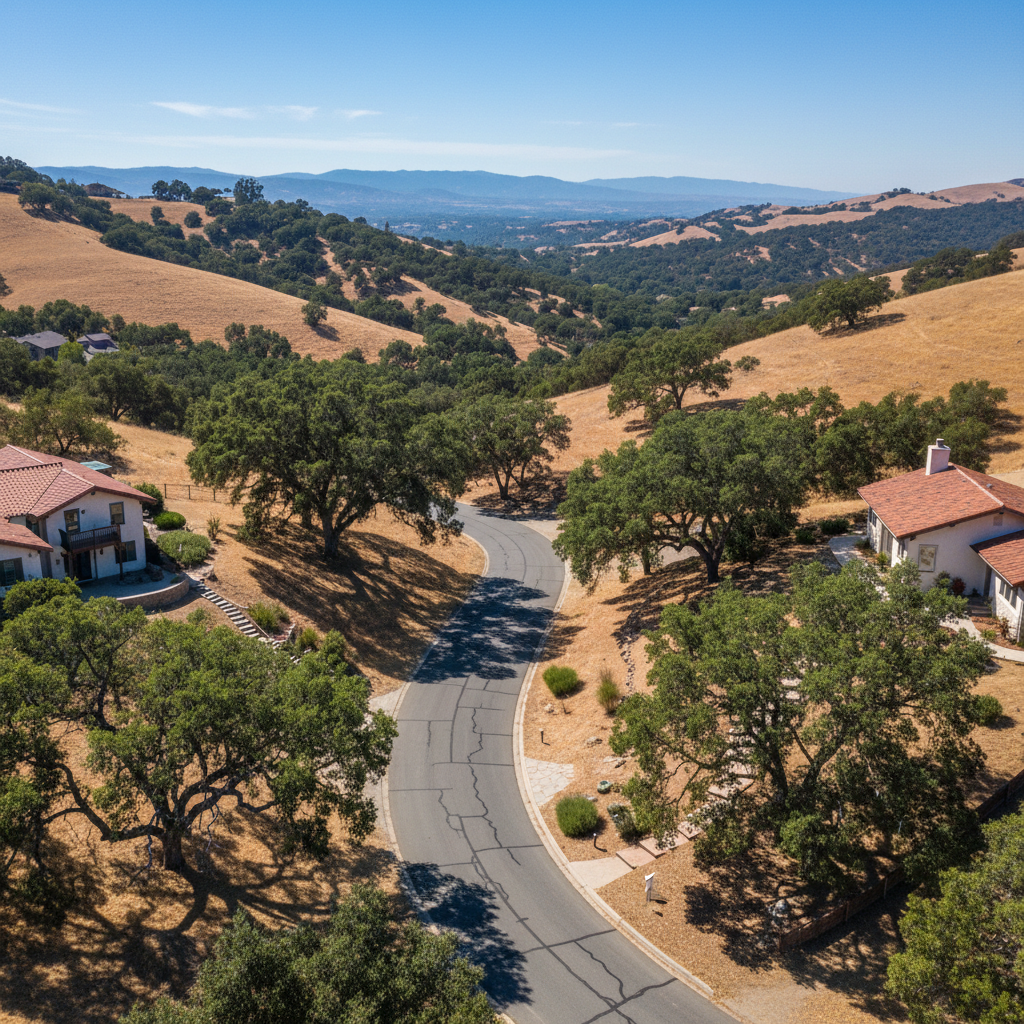
Ridgeline Rd — 14 parcels
One neglected lot changes the math for twelve neighbors.
Fire doesn't honor property lines. When parcel 047-221 carries unmaintained brush to the fence line, the ember load it generates during a wind event raises the ignition probability for every structure within 400 feet. Risk is contagious. We quantify exactly how contagious.
Neighbor exposure increase
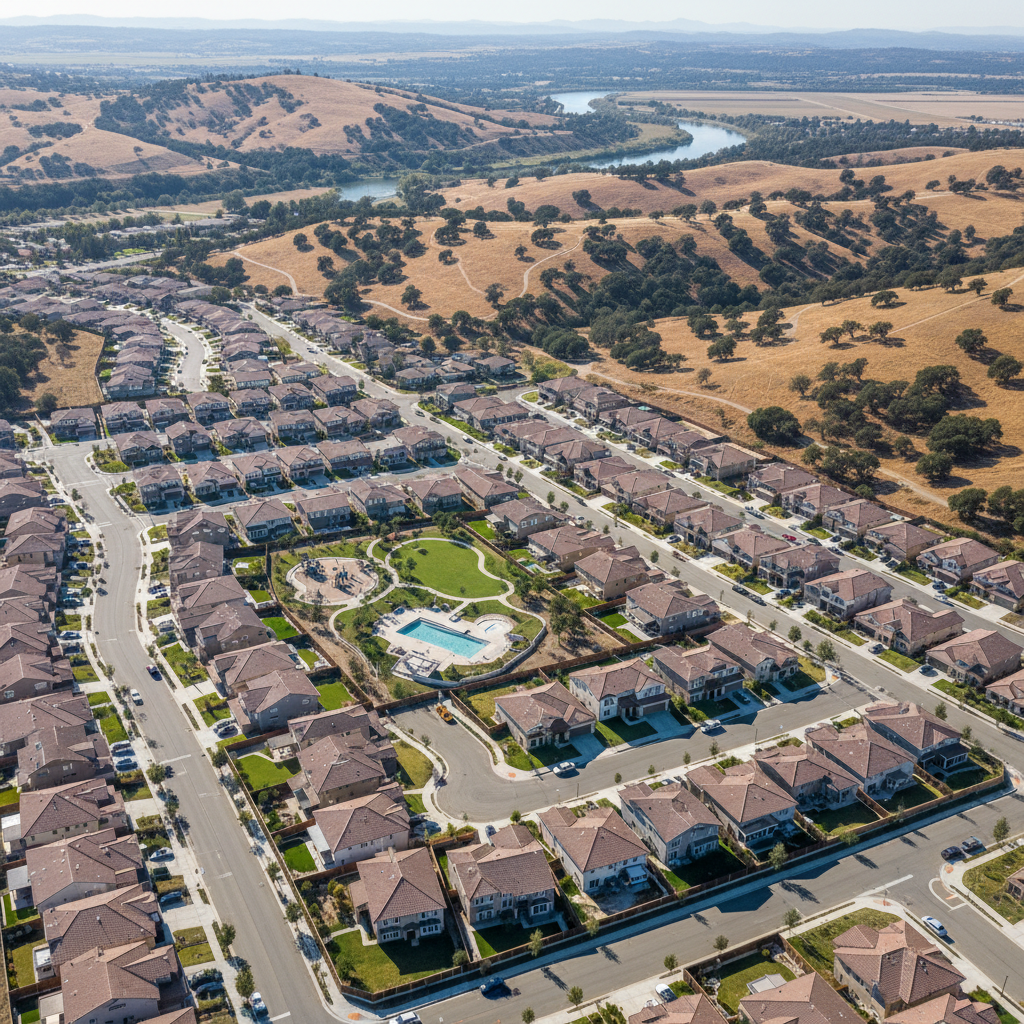
Oak Valley Estates — 312 parcels
Aggregate exposure, mapped to the lot.
At subdivision scale, patterns emerge that no single inspection would reveal. Three clusters of deferred maintenance. One HOA maintenance zone that accounts for 60% of community-wide ember exposure. One water main whose pressure drops during peak fire-weather conditions. We see it all.
Parcels analyzed
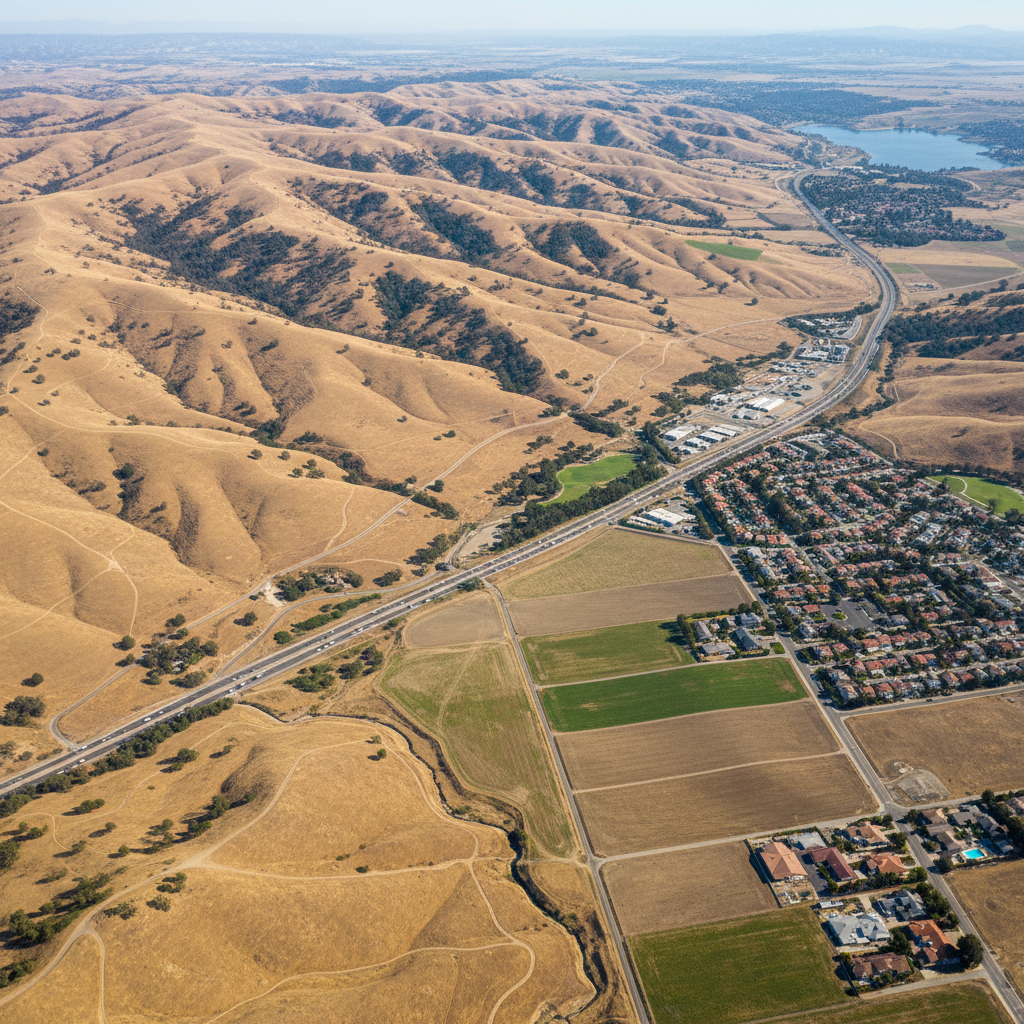
Napa County — 58,000 parcels
Where policy decisions become obvious.
County-wide, the data reveals where defensible-space grant dollars produce the greatest community-level risk reduction, which corridors carry fire fastest between watersheds, and which zip codes an insurer should reprice before the next red-flag season. The patterns were always there. Now you can see them.
Parcels in county view
The data serves
four kinds of decisions.
The risk is the same. What you need to do with it depends on who you are.
Turn parcel-level exposure data into defensible-space grant allocations that reduce community-wide risk by 40% per dollar spent. We deliver the GIS-ready layers your planning department needs to prioritize enforcement and communicate risk to residents without triggering panic.
"Ember gave us the data to justify a $2.4M defensible-space program to the Board of Supervisors in one presentation."
— Deputy Fire Marshal, Shasta County
Reprice rural portfolios before the next red-flag season. Ember's risk scores correlate directly to claims frequency — carriers using our data see 23% improvement in loss ratio on wildland-exposed books within 18 months of integration.
"We repriced 14,000 policies in Q3 using Ember data. Zero adverse selection complaints."
— Chief Underwriter, Western Mutual
Budget defensible-space grant programs with precision. Know exactly which parcels within your service boundary represent the greatest ignition risk to your infrastructure corridors before allocating crew time and materials.
"Ember identified 340 high-priority parcels we'd never have found through manual inspection."
— Operations Director, Marin Municipal Water District
Show residents exactly where their exposure lives — and exactly what to do about it. Ember generates resident-facing risk reports that drive compliance without litigation, turning HOA liability into community preparedness.
"Compliance with vegetation management went from 41% to 78% after we sent Ember risk reports to every homeowner."
— Portfolio Manager, Sierra HOA Group
The people who make
fire decisions trust this data.
Before Ember, we were making grant allocation decisions based on inspection reports that were 18 months old. Now we reprioritize every 90 days using current satellite-derived vegetation data. We've reduced our top-quartile risk parcels by 31% in two fire seasons.

Patricia Holloway
Deputy Fire Marshal
Sonoma County Fire & Emergency Services
High-risk parcel reduction
We write roughly 9,000 homeowners policies in the WUI across three Western states. After two seasons of using Ember scores as a primary underwriting input, our loss ratio on that book improved from 118% to 94%. The data is granular enough that we can price individual structures, not just zip codes.

Marcus Delgado
Chief Underwriting Officer
Pacific Crest Mutual Insurance
Loss ratio (from 118%)
Our water district has 40 miles of above-ground infrastructure running through high-fire terrain. Ember's corridor analysis identified 14 parcels where unmaintained vegetation directly threatened our transmission lines. We cleared those parcels before last October's wind event. Two of them would have burned.

Dr. Yuki Tanaka
Infrastructure Risk Director
East Bay Municipal Utility District
Critical parcels identified
See a real neighborhood
before you commit to a call.
A 24-page sample risk report for a 47-parcel HOA in Marin County — complete with parcel scores, defensible-space recommendations, and HOA liability summary. The same format your procurement team will circulate internally.
- —Parcel-level risk scores with methodology notes
- —Satellite-derived vegetation density maps
- —Defensible-space gap analysis per structure
- —HOA aggregate liability estimate
Request a
County Assessment.
Tell us about your jurisdiction or coverage area. We'll review your portfolio parameters and return a scoped proposal within two business days — including a complimentary risk preview for three parcels of your choosing.
Scoped proposal in 48 hrs
Coverage area, deliverable format, timeline, and pricing.
Three-parcel preview
We run a live analysis on parcels you specify — at no cost.
Data delivery your way
GIS layers, API feed, PDF reports, or dashboard access.
Currently serving